
| HELP | |
| Beta 1 year in basis pts | |||||||||||||||||||||||||||||||||||||||||||||||||||||||||||||||||||||||||
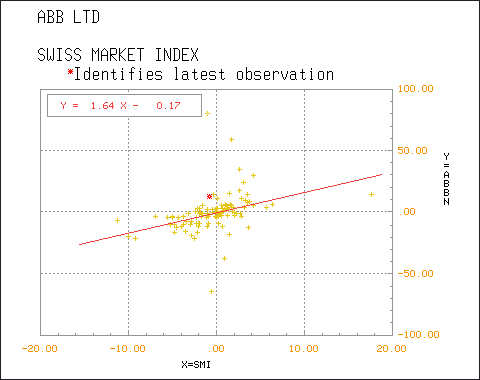
Beta measures the sensitivity of a stock relative to market movements. By definition, the market has a Beta of 1.0. To be consistent with our other indicators, the number we use to express Beta is 100, which is equivalent to the number 1.0. Stocks with a Beta greater than 100 tend to amplify the overall movements of the market. Stocks with a Beta between 0 and 100 tend to move in the same direction as the market, but not as far. The market can be considered as the portfolio of all stocks, so the "average stock" has a Beta of 100.
 |
|||||||||||||||||||||||||||||||||||||||||||||||||||||||||||||||||||||||||
| Group | |||||||||||||||||||||||||||||||||||||||||||||||||||||||||||||||||||||||||
The 5000 stocks in theScreener.com's database are divided into 18 internationally recognized standard industry groups.
|
|||||||||||||||||||||||||||||||||||||||||||||||||||||||||||||||||||||||||
| Growth to PE Ratio | |||||||||||||||||||||||||||||||||||||||||||||||||||||||||||||||||||||||||
It is the basis of our Valuation Rating. This is the estimated growth of future earnings (LT Our G/PE |
|||||||||||||||||||||||||||||||||||||||||||||||||||||||||||||||||||||||||
| Stars | |||||||||||||||||||||||||||||||||||||||||||||||||||||||||||||||||||||||||
In this easy-to-use rating system, stars are earned for each element specified below:
Therefore, a stock can earn a maximum of four stars. The lowest rating a stock can have is no stars. Note : For each category, once a stock has earned its star it will keep it until:
|
|||||||||||||||||||||||||||||||||||||||||||||||||||||||||||||||||||||||||
| Long Term Growth | |||||||||||||||||||||||||||||||||||||||||||||||||||||||||||||||||||||||||
This is the estimated annual growth rate of future earnings, normally projected over the next two to three years, and expressed as a percentage. Our Long Term Growth measure is averaged over at least three different estimates obtained from banks, brokers, or analysts. A figure of 18 means that for the next two to three years, the growth in company earnings is evaluated at an average of 18% per year. Caution: Be skeptical of high long-term growth projections that differ greatly from growth rates of associated national market indexes or industry groups. These can often result from very low earnings for the most recent few years, thereby making a firm's projected earnings growth appear very strong by comparison with the lean years. To verify this information the Industries and Indexes functions can be very helpful. |
|||||||||||||||||||||||||||||||||||||||||||||||||||||||||||||||||||||||||
| Long Term P/E | |||||||||||||||||||||||||||||||||||||||||||||||||||||||||||||||||||||||||
It is the PE ratio calculated on the basis of estimates of long-term earnings. |
|||||||||||||||||||||||||||||||||||||||||||||||||||||||||||||||||||||||||
| Market | |||||||||||||||||||||||||||||||||||||||||||||||||||||||||||||||||||||||||
theScreener.com provides analysis on stocks from 32 countries; we call those countries, Markets.
|
|||||||||||||||||||||||||||||||||||||||||||||||||||||||||||||||||||||||||
| Market Capitalization in $bn | |||||||||||||||||||||||||||||||||||||||||||||||||||||||||||||||||||||||||
This number is calculated by multiplying a firm's share price by the number of outstanding shares. |
|||||||||||||||||||||||||||||||||||||||||||||||||||||||||||||||||||||||||
| Price Ccy | |||||||||||||||||||||||||||||||||||||||||||||||||||||||||||||||||||||||||
This is the price of a stock at the time of the latest update, and the currency that it is traded in. |
|||||||||||||||||||||||||||||||||||||||||||||||||||||||||||||||||||||||||
| Sensitivity | |||||||||||||||||||||||||||||||||||||||||||||||||||||||||||||||||||||||||
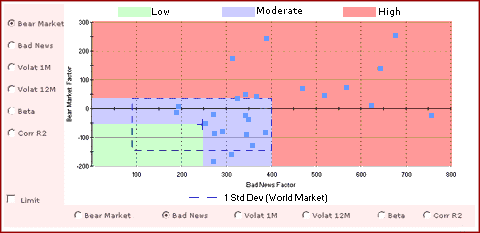
Sensitivity is determined by measuring the "Bear Market Factor" and the "Bad News Factor" against the world reference. A stock will appear on the sensitivity map as a single point created by plotting its "Bear Market Factor" on the Y axis and its "Bad News Factor" on the X axis. There are three types of sensitivities:
 |
|||||||||||||||||||||||||||||||||||||||||||||||||||||||||||||||||||||||||
 ]
] ], [
], [ ]
] ]
] ]
]